Toolkit
Signal-to-Noise Ratio
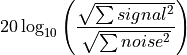
This calculates the signal-to-noise ratio for any input signal. Signal-to-Noise ratio is defined as the ratio between the power of the desired signal to the power of the background noise.
If the noise magnitude is provided along with the signal, the SNR is calculated using the following formula:
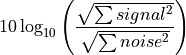
If the noise magnitude is not provided, a modified periodogram is computed using a Kaiser window with  and the SNR is computed using the power of fundamental frequency and the power of the signal after removing the top 6
harmonics. The formula used in this case is:
and the SNR is computed using the power of fundamental frequency and the power of the signal after removing the top 6
harmonics. The formula used in this case is:
The SNR value can also be computed by providing the periodograms of power spectral density  or
power spectrum
or
power spectrum  . In case of power spectrum periodograms,the resolution bandwidth needs to be provided
as well. Utilities provide the
. In case of power spectrum periodograms,the resolution bandwidth needs to be provided
as well. Utilities provide the enbw() function which computes the estimated noise bandwidth for assessing
the resolution bandwidth.
Total Harmonic Distortion
This calculates the total harmonic distortion for any signal. Total harmonic distortion is defined as the ratio of the power of the harmonics to the power of the fundamental frequency.
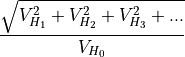
A modified periodogram is computed using a Kaiser window with and this information is then used to
determine the fundamental frequency and its harmonics. The formula used for computing the THD is:
The THD value can also be computed by providing the periodograms of power spectral density or
power spectrum . In case of power spectrum periodograms, the resolution bandwidth needs to be provided
as well. Utilities provide the enbw() function which computes the estimated noise bandwidth for assessing
the resolution bandwidth.
Signal to Noise and Distortion Ratio
This calculates the signal-to-noise-and-distortion ratio for any signal. SINAD is defined as the ratio between the power of the signal’s fundamental frequency to the power of the background noise and harmonics.
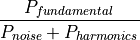
A modified periodogram is computed using a Kaiser window with and this information is then used to
determine the fundamental frequency and its harmonics. The formula used for computing the SINAD is:
The SINAD value can also be computed by providing the periodograms of power spectral density or
power spectrum . In case of power spectrum periodograms, the resolution bandwidth needs to be provided
as well. Utilities provide the enbw() function which computes the estimated noise bandwidth for assessing
the resolution bandwidth.
Third Order Intercept
This calculates the third order intercept point for a signal. There are six third-order intermodulation points from the
top two dominant frequencies  and
and  (fundamental signals) —
  ,
,  ,
,
 ,
,  ,
,  and
and  . Amongst these, the hardest to handle
are and because of how close they are to the fundamental signals. TOI helps us
compute the point at which the power of the third order products intercepts the power of the fundamental signals. In
real world devices, this does not happen because the output power is limited; hence, the TOI is a theoretical value.
TOI helps evaluate the linearity of the signal source. The higher the TOI, the better the linearity with lower levels of
intermodulation distortion.
. Amongst these, the hardest to handle
are and because of how close they are to the fundamental signals. TOI helps us
compute the point at which the power of the third order products intercepts the power of the fundamental signals. In
real world devices, this does not happen because the output power is limited; hence, the TOI is a theoretical value.
TOI helps evaluate the linearity of the signal source. The higher the TOI, the better the linearity with lower levels of
intermodulation distortion.
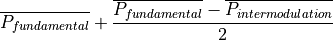
A modified periodogram is computed using a Kaiser window with and this information is then used to
identify the two dominant frequencies and which is considered the fundamental signal. The formula
used for computing the TOI is:
The TOI value can also be computed by providing the periodograms of power spectral density or
power spectrum . In case of power spectrum periodograms, the resolution bandwidth needs to be provided
as well. Utilities provide the enbw() function which computes the estimated noise bandwidth for assessing
the resolution bandwidth.
Spurious Free Dynamic Range
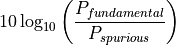
This calculates the spurious free dynamic range of a signal. SFDR is defined as the strength ratio of the fundamental signal to the strongest spurious signal.
A modified periodogram is computed using a Kaiser window with and this information is then used to
determine the fundamental frequency and its harmonics. The formula used for computing the SFDR is:
The SFDR value can also be computed by providing the periodograms of power spectral density or
power spectrum . In case of power spectrum periodograms, the resolution bandwidth needs to be provided
as well. Utilities provide the enbw() function which computes the estimated noise bandwidth for assessing
the resolution bandwidth.